Custom Reporting is available through the enterprise plan or as an additional paid feature. If you would like MMC to build out your custom reports, please reach out here to inquire about purchasing service hours
To access custom reporting:
- Navigate to Reports in the top menu bar.
- Select Custom Reports under Menu.
- Select one of your Pinned Dashboards or All Custom Dashboards.
To create a custom dashboard:
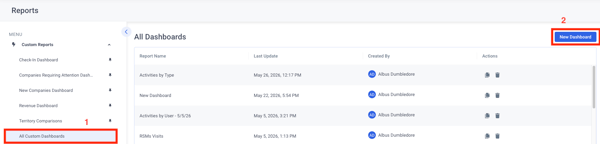
- Select All Custom Dashboards.
- Click New Dashboard in the top right.
To rename your custom dashboard:
- Click on the title.
- This will have a placeholder text of 'New Dashboard'.
- Type in your desired name.
To add an item to your dashboard:
- Click +Add item.
- Select the desired item from the list.
Filters and charts live on the custom dashboard inside of items
Filter items include (but are not limited to):
- Drop down lists
- Slicers
- Date pickers
Visualization items include (but are not limited to):
- Table/Pivot Table
- Bar Charts
- Pie Charts
- Line Graphs
- Speedometers
The Item action menu offers access to the following controls: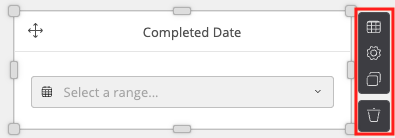
- Data
- View the fields used to populate data on your item, all applied filters and determine how data is aggregated on the item (sum, avg, median, etc...).
- Settings
- Access and alter items settings included but not limited to: adding a title, altering targets, sort orders and theme.
- Clone
- Creates an exact copy of the item including dimensions, data, filters and aggregations.
- Delete
To add data to your item:
- Select the dataset you wish to use on the right.
- Only the Activities and Company datasets can be combined on a single item. Attempting to combine data from any other dataset is not supported and may cause errors on your item or incorrect aggregations & filters on your dashboard.
- Drag and drop fields from the dataset onto the desired section of the item.
In the above example the chosen fields display total number of activities for each rep categorized by type.
- Measure: Unique ID (counts all activities on the unique field)
- Rows: Assignee Email
- Columns: Activity Type
To filter the data on your dashboard:
Note: Filters will not work as intended if trying to filter on datasets that are not cross-compatible.
Using a filter item:
- Click +Add item.
- Select the desired filter.
- Add the field you would like to filter on using the steps above.
- Select the value or range from the field that you would like to filter on.
Using a dashboard filter:
- Click Filters on the right.
- Select from the available datasets under DASHBOARD FILTERS.
- Click Add a filter.
- Click Add filter on Manage dashboard filters pop-up.
- Select the Field, Comparison and Elements.
- Click Apply filters.
To filter data on a single item:
- Click on Data in the item you wish to filter's action menu.
- Click the pink Add filter button.
- Select the Field, Comparison and Elements.
- Click Apply filters.
To manage sharing for your dashboard:
Only the user with a creator license can make edits to a dashboard. A user without a creator license will only be able to view a dashboard that has been shared with them and the data on the dashboard will reflect what their MMC permissions give them access to.
i.e. a user will only see their activities or the team they manage's activities.
- Click Share in the top right.
- Click + Share With and select from:
- Member
- Team
- Organization
- Make your selection(s) from the desired menu and click Add.
- Click Save.
To quickly export your dashboard:
- Select Export in the top right.
- An image of your dashboard reflecting the current data displayed will be downloaded as a .png.
Additional Dashboard Controls:
Clicking the Dashboard dropdown menu provides access to the following controls:
- Export
- Schedule exports to be delivered via email
- Preview
- Version History
- Variants
- Variants are alternate version of the dashboard that are accessed through the variants menu and will not appear in the All Custom Dashboards list.
- A variant may be applicable when you want to surface the same fields and filter them to a specific rep or account.
- Delete
To email exports of your dashboard:
- Click Dashboard in the top right.
- Select Export.
- Select the view for your export.
- Phone, Tablet or Desktop.
- Select the file type for your export.
- .png or .pdf.
- Select if the current filters will be applied.
- Select either a single e-mailed export or regularly scheduled e-mailed export.
- If you are scheduling your export, enter the start date and frequency.
- Select Use customized message if you would like to dictate the subject and body of your email.