Open the Kanban Board
- From the dashboard Deals Overview widget, tap into Full Board View.
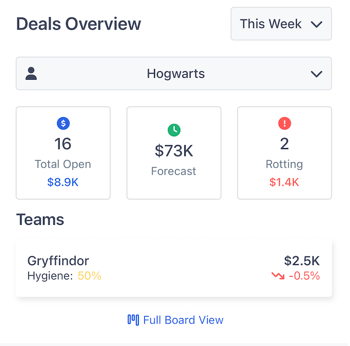
- The pipeline appears in Kanban format.
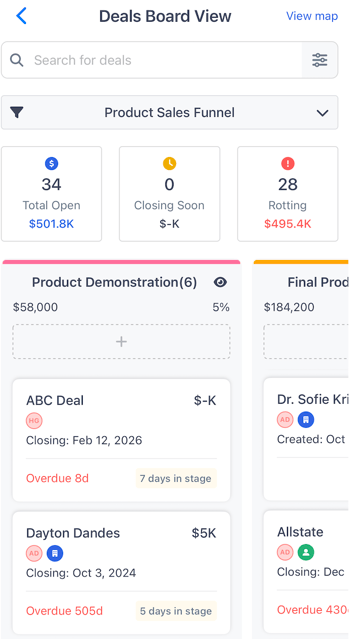
- Each stage is displayed as a column containing deal cards.
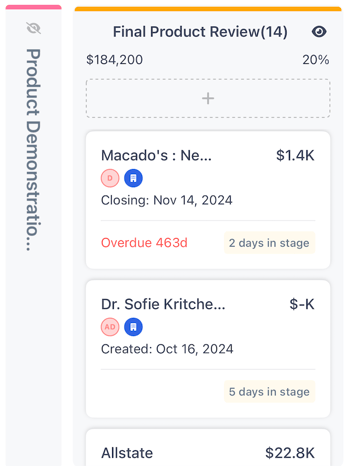
Understand Deal Cards
Each deal card displays key information, such as:
- Deal name
- Company
- Deal value
- Assignee
- Close date
- Last activity
- Days in stage
To open a deal:
Tap the card to view the full deal record. The board position is preserved.
Move Deals Between Stages
- Long-press the deal card.
- Drag the card to the target stage column.
- Release to update the deal.
Changes are reflected immediately.
Switch Pipelines
- Tap the Funnel Selector.
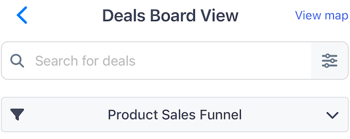
- Select the desired pipeline.
- The board refreshes to show the selected pipeline.
Add a New Deal
- Tap the + (plus) button at the top of the Stage.
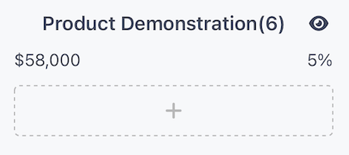
- Enter the required deal details.
- Save the deal.
Use Quick Filters
Quick filters help you focus on specific deal groups.
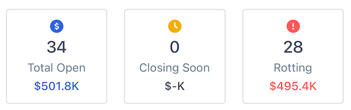
Available options include:
- Total Open
- Closing Soon
- Rotting Deals
To apply a quick filter:
- Tap the desired filter.
- The board updates automatically.
Use Saved or Custom Filters
- Open the Filters menu by selecting the filter icon on the left of the search bar.
- Select a saved filter or create a new one.
- Apply the filter to update the board.
Search for Deals
- Tap the search bar.
- Enter a deal name or keyword.
- Select the result to open the deal.
Hide Cards
To simplify the board view:
- Use the Hide Cards option by clicking the eye to the right of the Stage Name.
- Selected cards are temporarily hidden from the board.
View Deals on the Map
- Tap View Map.
- Deals appear plotted by location.
Use this view to review geographic distribution of deals.
Stage Metrics and Totals
Each stage column displays summary information, including:
- Deal count
- Adjusted value
- Probability
You can also sort deals by fields such as close date or amount and view stage totals at the top of each column.